How the Bitcoin Cycle Score Works, Step by Step
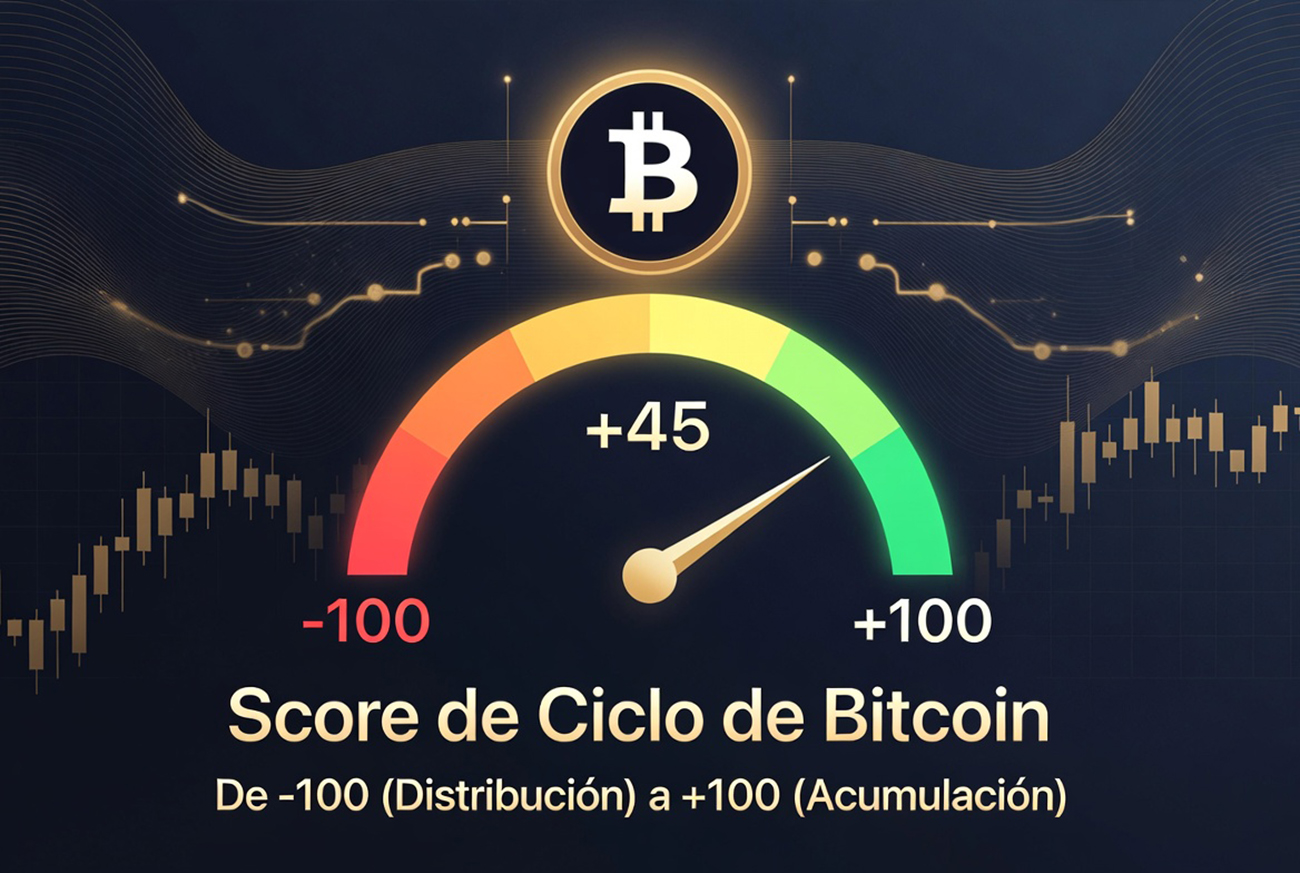
The Score summarizes which phase of the Bitcoin cycle we're in as a number from -100 to +100. It combines data from our own node, on-chain metrics, and macro context, each with an identifiable source. We publish what each piece measures; we withhold only the exact proportions.
The BlockPulse Analytics Score summarizes, in a single value between -100 and +100, which phase of the Bitcoin cycle we're in: accumulation (positive values), distribution (negative values), or something in between. It's not a secret formula or a black box: it's a combination of about a dozen public and proprietary indicators, each with an identifiable source and a concrete reason for being there. This article explains what makes it up, how it's calculated, what we withhold, and -- most importantly -- how you can verify that it works.
A number that summarizes the cycle
The underlying idea is simple: the Bitcoin market moves in cycles, largely marked by halvings (the roughly-every-four-years reduction in new issuance). Throughout each cycle there are phases where, historically, it's been more reasonable to accumulate (prices low relative to the cycle, widespread pessimism) and phases of higher risk (high prices, euphoria). No single indicator captures that phase well on its own: price alone can't tell a passing correction from a cycle change, and sentiment alone is noisy. The Score exists to combine many different angles into a single reading, weighting the ones we consider more reliable more heavily.
The three types of data that make it up
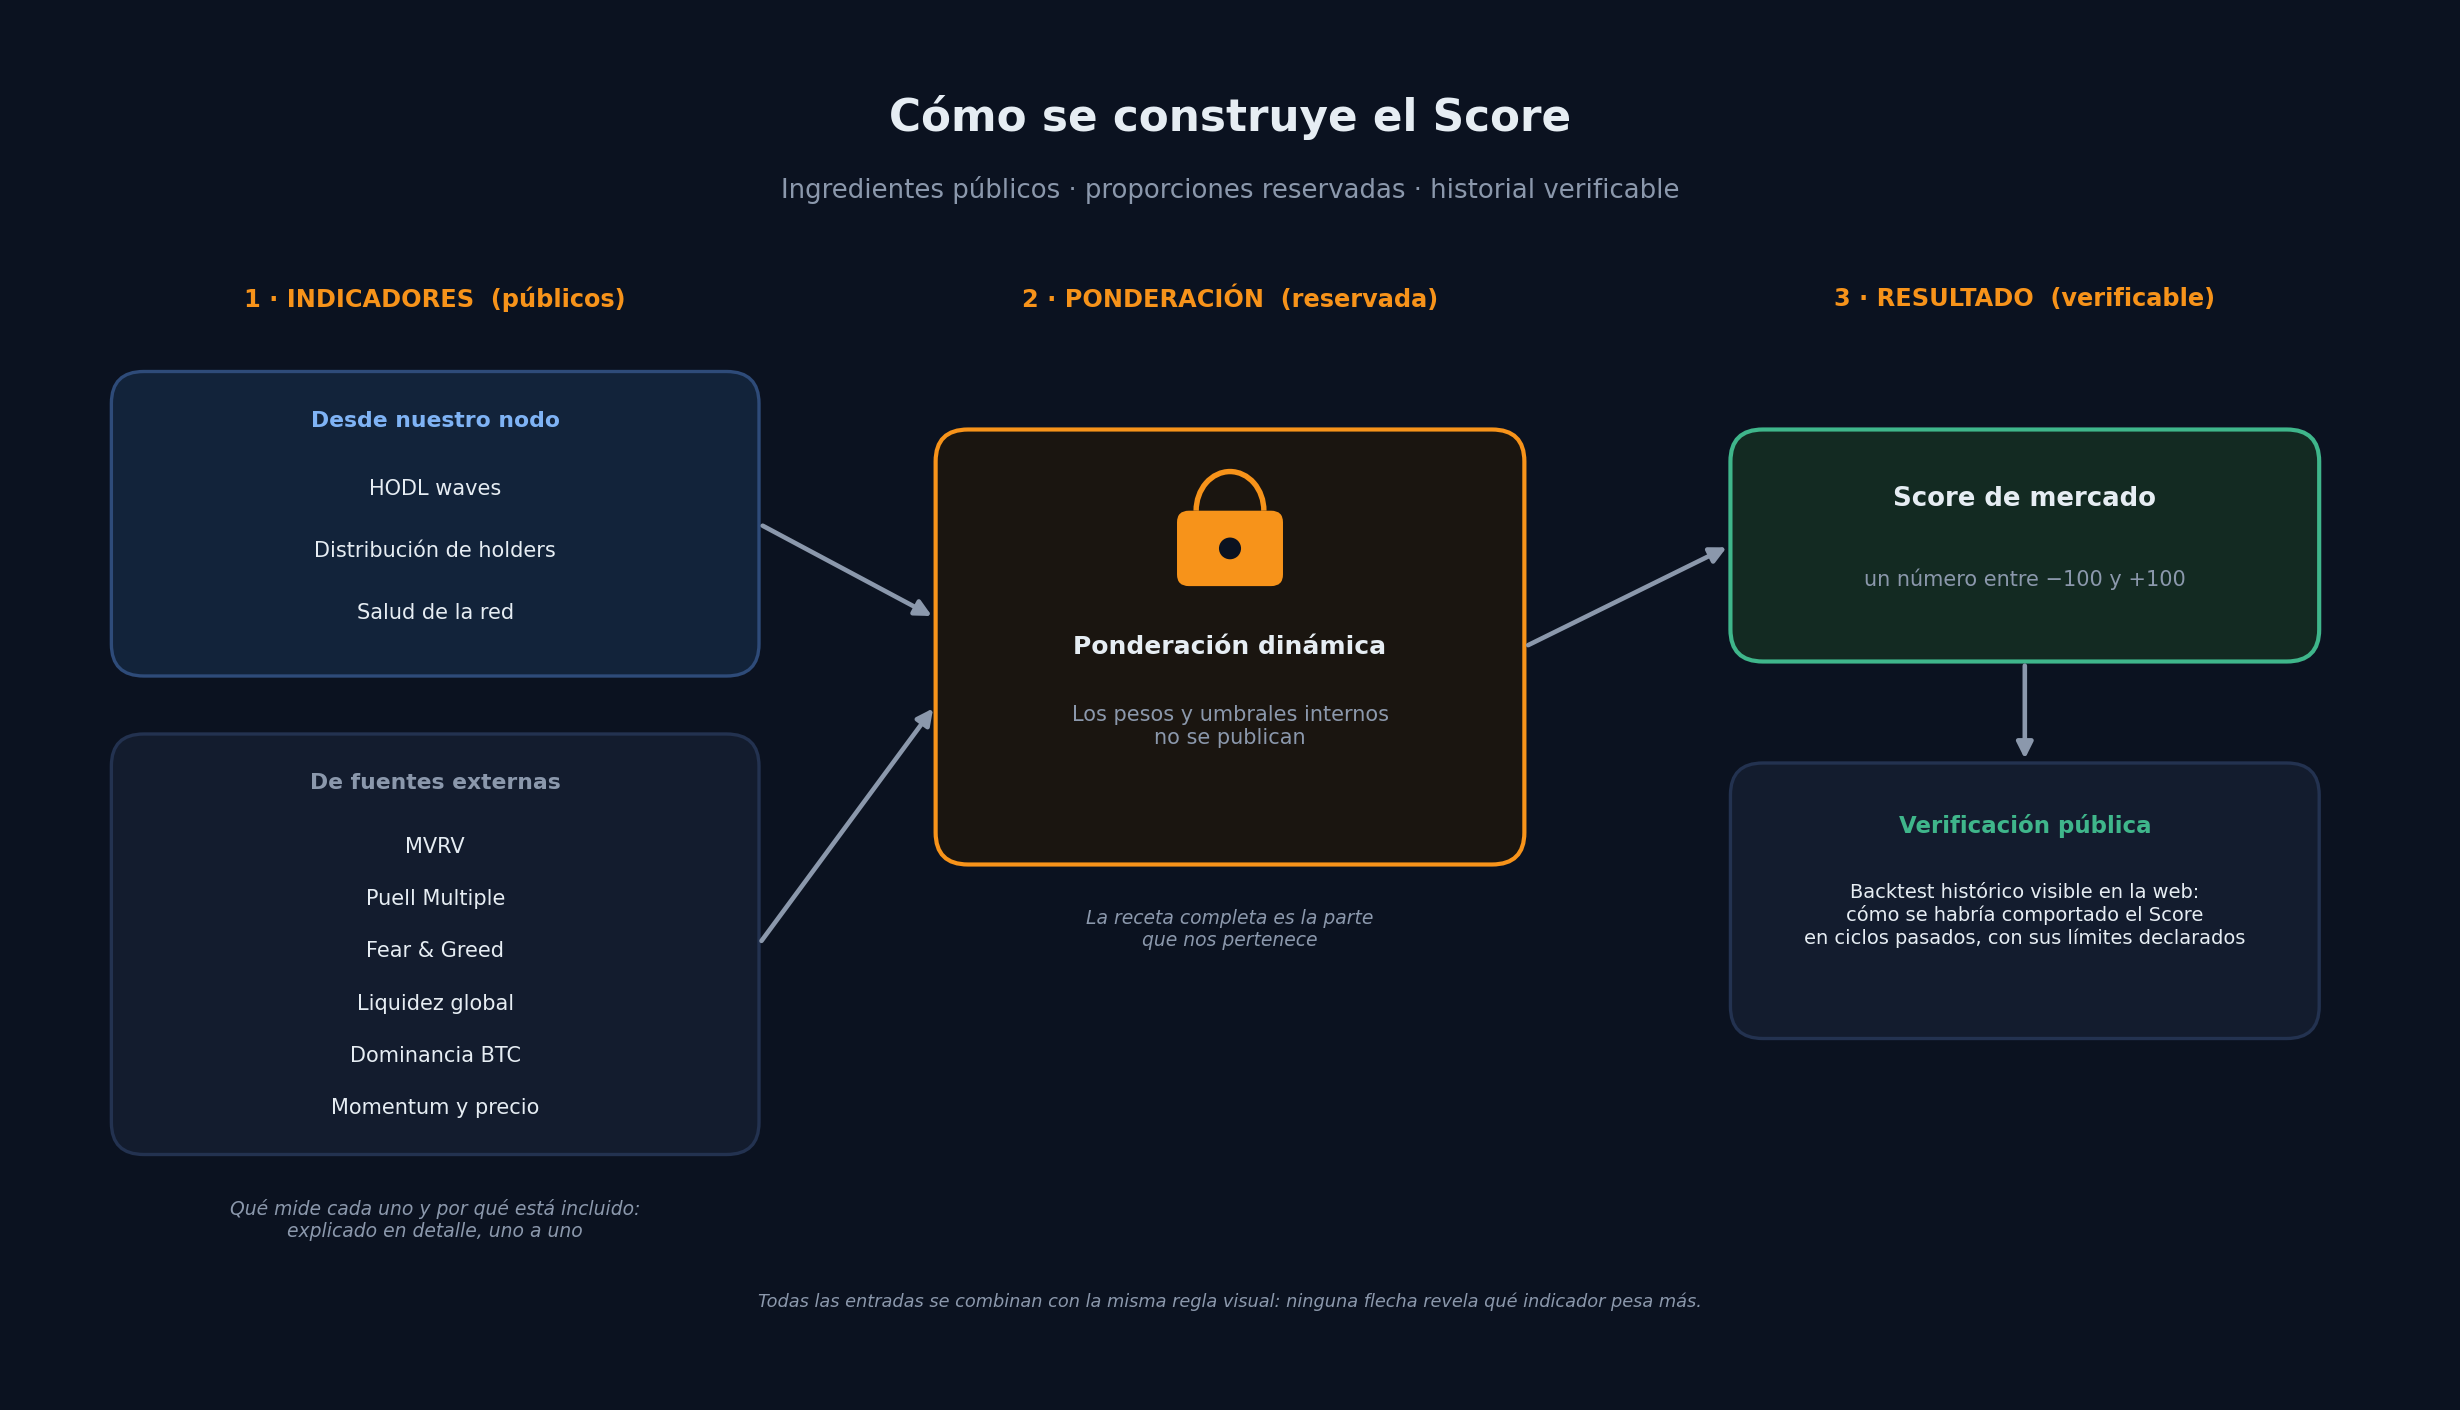
The Score doesn't draw from a single source -- it combines three very different families of indicators:
1. Data from our own Bitcoin node. This is the component we weight most heavily, and the reason is central to this project: it's data verified directly against the blockchain, not proxies from a third-party API that could change its criteria without notice. It includes the supply distribution by age (HODL waves) and by wallet size, plus the hashrate "hash ribbon" calculated straight from the chain itself. Calculating this requires a full node -- no free API offers it.
2. On-chain market metrics. MVRV (the ratio between market value and realized value), net exchange flow, the trend of BTC held on exchanges, and the Puell Multiple (mining profitability). All calculated from public data via the Coin Metrics Community API, no paid key required.
3. Sentiment and macro context. The Fear & Greed Index, Bitcoin dominance, perpetual futures funding rate, price action (drawdown from the two-year high and position relative to the 200-period average), and global liquidity (the Federal Reserve's weekly balance sheet). These are the pulse of the market and the macro environment around Bitcoin.
How the indicators are combined
Each indicator, whatever its original unit (a ratio, a percentage, a 0-100 index), is first normalized to a common scale of -100 (distribution) to +100 (accumulation), using calibrated and documented thresholds for each one. That way, signals as different as "MVRV below 1" and "Fear & Greed in extreme fear" become comparable and summable.
They're then combined in a weighted average: each indicator contributes according to its weight, and the result is the final Score. Two important details of methodological honesty:
- Missing data is never filled in with a neutral value. If an indicator has no data on a given day (for example, while our node is still syncing), it's excluded from the calculation and the rest is re-weighted over what's actually available. We never assume "neutral" for a data point we simply don't have.
- Confidence always travels with the number. Alongside the Score we show a confidence level (0-100%) that reflects how much real data coverage backs today's reading -- not a statistical probability, but how many pieces are actually available. A Score with low confidence is a Score that should be read with extra caution, and the site says so explicitly.
The classification zones
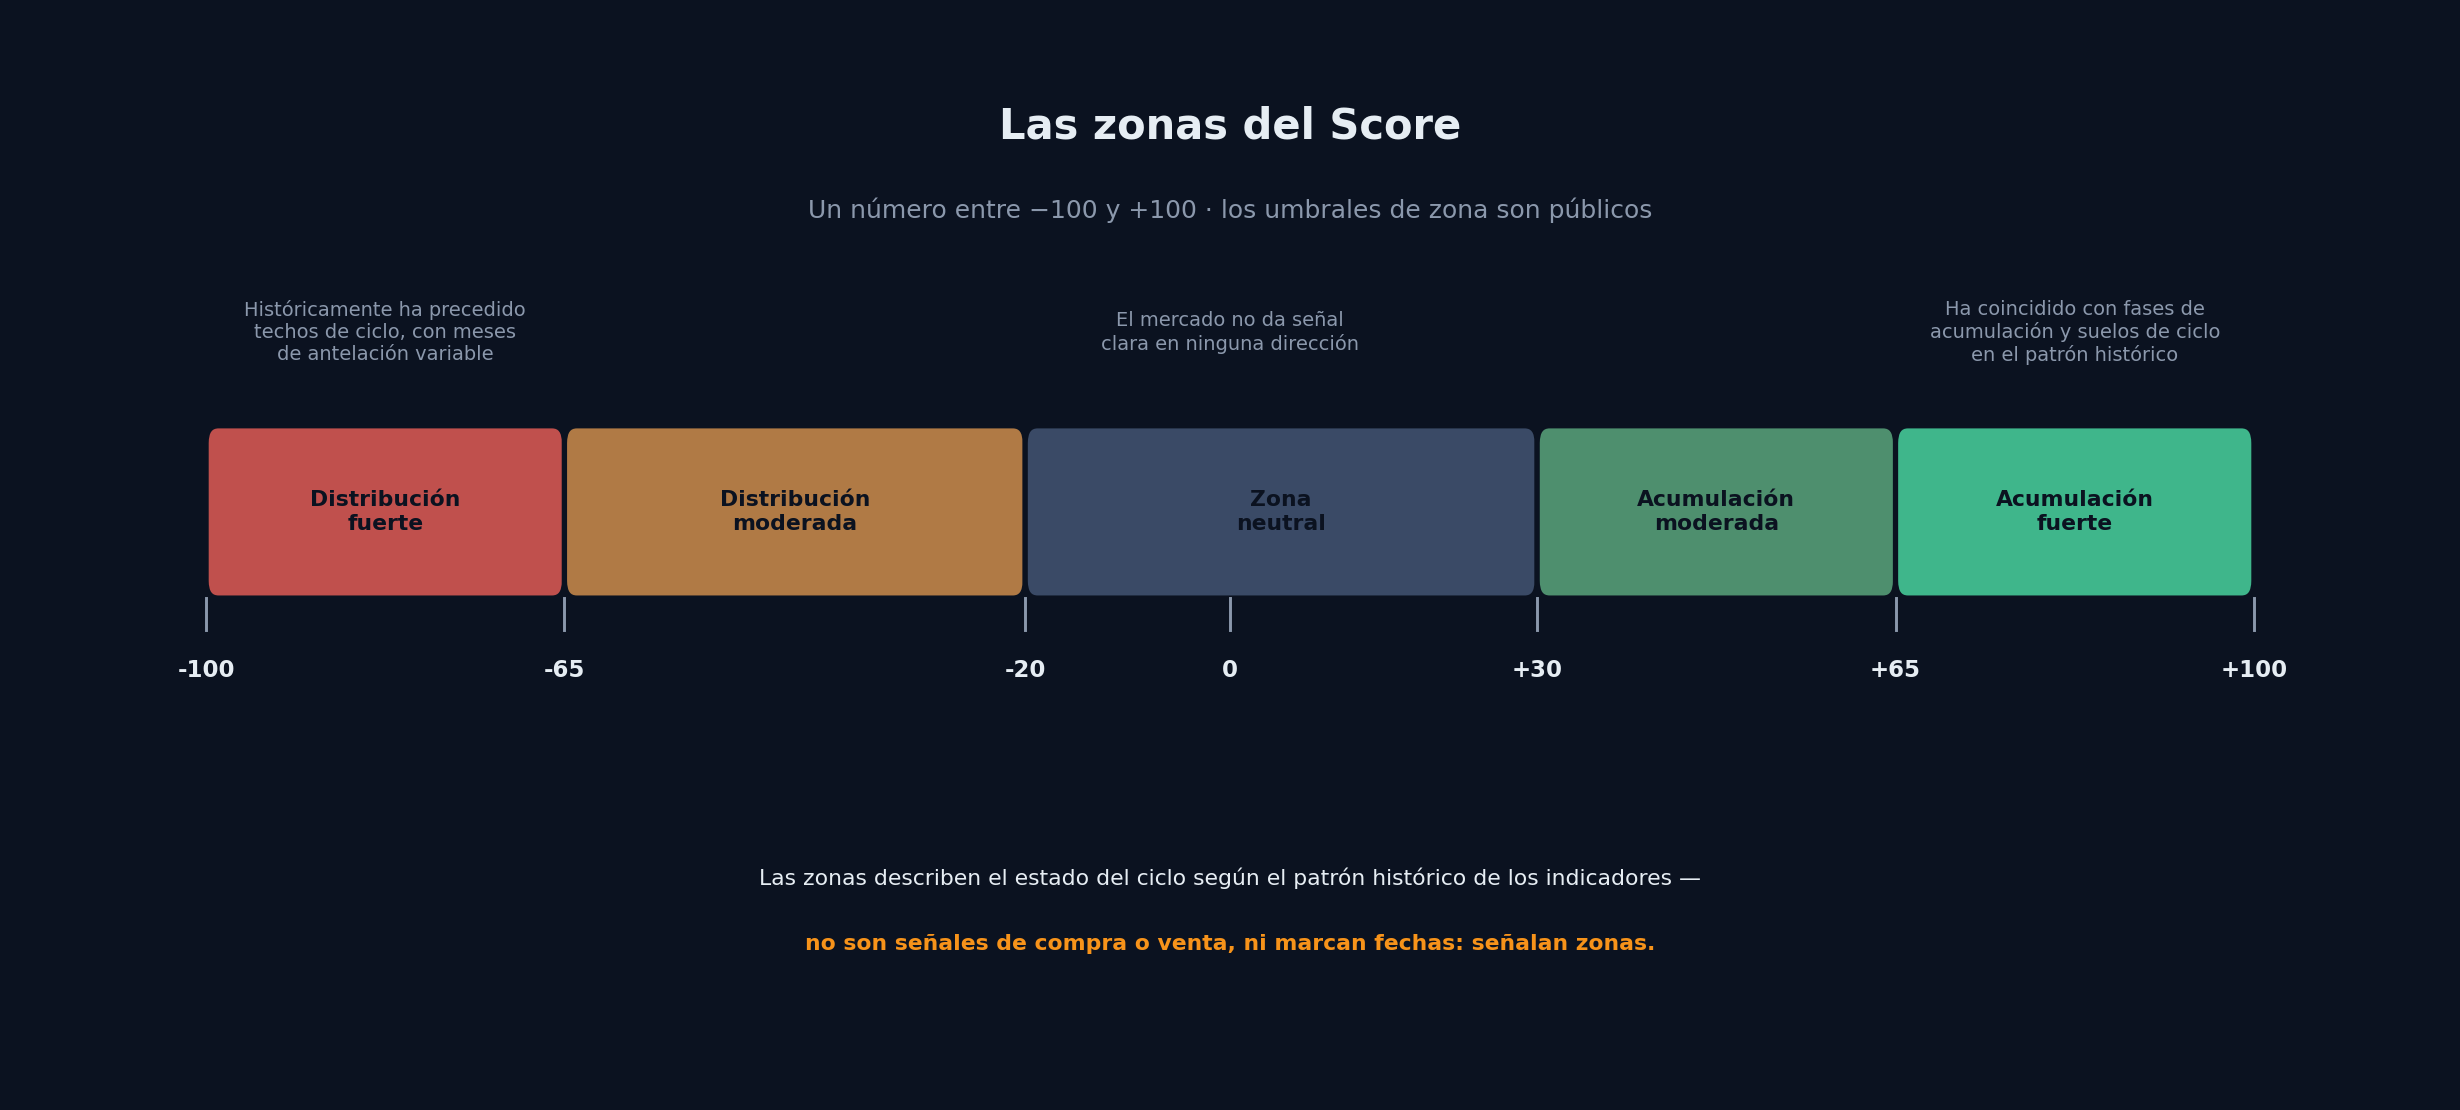
The final number translates into one of five zones, from strong distribution to strong accumulation. These zone thresholds are public -- what's withheld is each indicator's internal weight, not the boundaries between phases:
What we withhold, and why
We publish what each indicator measures, where the data comes from, and which direction it's currently pushing the Score (up, down, or neutral). What we always withhold is the exact weight of each indicator and the internal logic of how they combine.
It's not because we distrust the person reading this. It's a simple decision, and we explain it with an analogy: you know every ingredient in the recipe and where each one comes from, but not the exact proportions. If we published the full formula, anyone could reconstruct the Score without needing our data -- and this project's real value lies in verifying that data against our own Bitcoin node, not in a formula anyone could copy.
And here's the key point: the legitimacy of that reserve doesn't depend on you trusting our word -- it depends on you being able to check the track record. That's why what we do next is show the complete track record, not ask for faith.
How to check that it works (the backtest)
In the Market section we publish the Score's backtest since 2018: the Score's historical series overlaid on Bitcoin's price, so anyone can check what it showed at any point in the cycle. Two well-known cases illustrate the idea: at the November 2021 top, the Score was in the distribution zone, and at the November 2022 bottom -- right after the FTX collapse -- it was in the accumulation zone. No need to trust us: it's drawn out and verifiable.
That said, we're upfront about what that backtest can and can't prove. The historical backtest uses 7 of the 10 indicators from the live Score: the three without continuous history are left out (own node, dominance, and global liquidity). Since those three account for a significant share of the total weight, the backtest's average confidence sits around 59%, versus roughly 95% for the live Score. That lower figure isn't an error: it's the honest signal that the backtest uses fewer pieces than today's Score. And with only a couple of complete Bitcoin cycles in the historical record, no backtest -- including ours -- can be treated as statistically conclusive proof. It's a credible, verifiable illustration, not a guarantee.
The same discipline applies behind the scenes. Any change we evaluate to the Score -- adding an indicator, adjusting a threshold, changing how things combine -- goes through an internal validation protocol before being adopted: it's calibrated on one stretch of history and validated on a different one (never the same one), and it's only accepted if it improves things robustly, not if it "looks nice" on the chart. We keep a record of what was tested, what it showed, and what got discarded. The detail of that record is internal -- it's part of the withheld formula -- but its existence isn't: it's what keeps the Score from being tuned by looking at the past with an unfair advantage, the single easiest mistake to make (without meaning to) with this kind of indicator.
What the Score does NOT measure
An honest indicator declares its boundaries instead of hiding them:
- It's Bitcoin-only. It doesn't see capital rotation into altcoins or signals from other markets. That's a design decision (Bitcoin is the asset with the most solid, verifiable on-chain data available), not an oversight -- but it means there are market dynamics the Score, by construction, doesn't capture.
- It's not a timing tool. It locates the cycle phase; it doesn't mark the exact day of a top or bottom. It can sit in a zone for weeks or months before price reacts.
- It's not financial advice. It's an informational heuristic. The Score being in the accumulation zone isn't a buy order, nor is distribution a sell order: that depends on your own strategy and risk tolerance.
How it's used in practice
On the site, the Score always shows up with three pieces of context that keep it from being read as an oracle:
- The confidence level described above, to know how much data coverage backs today's number.
- The top three reasons most influencing the Score right now, with their direction (up/down) and a qualitative strength (strong/mild) -- never an exact magnitude, per the reserve rule already explained.
- A Score DCA simulator that lets you compare, using real historical data, how investing with regular periodic contributions would have performed versus modulating those contributions based on the Score's signals.
None of this replaces your own judgment. The Score is a tool for understanding the Bitcoin cycle with verifiable data and its limits in plain view -- not a buy or sell signal. You can see it live, with its full context, in the Market section.
Last updated: 2026-07-09