Where the BlockPulse Analytics Score Has Failed
We also publish where the Score hasn't worked: the distribution signal isn't useful for timing the short term, in the historical reconstruction the indicator has never marked "Strong Accumulation," and the Score DCA simulator hasn't demonstrated any advantage over traditional DCA.
Almost everything written about the BlockPulse Analytics Score explains how it works and what it got right. This page is the necessary counterpart: what hasn't worked, with the exact numbers, unpolished. It's the same discipline we already apply to the rest of the project -- if the track record is the proof the Score deserves trust, hiding the part that doesn't look good would invalidate that proof.
You can read the full Score methodology first if you don't know which indicators make it up or how they combine -- that part isn't repeated here, only the three concrete failures we've found while reconstructing its history.
Failure 1: the distribution signal doesn't work for timing the short term
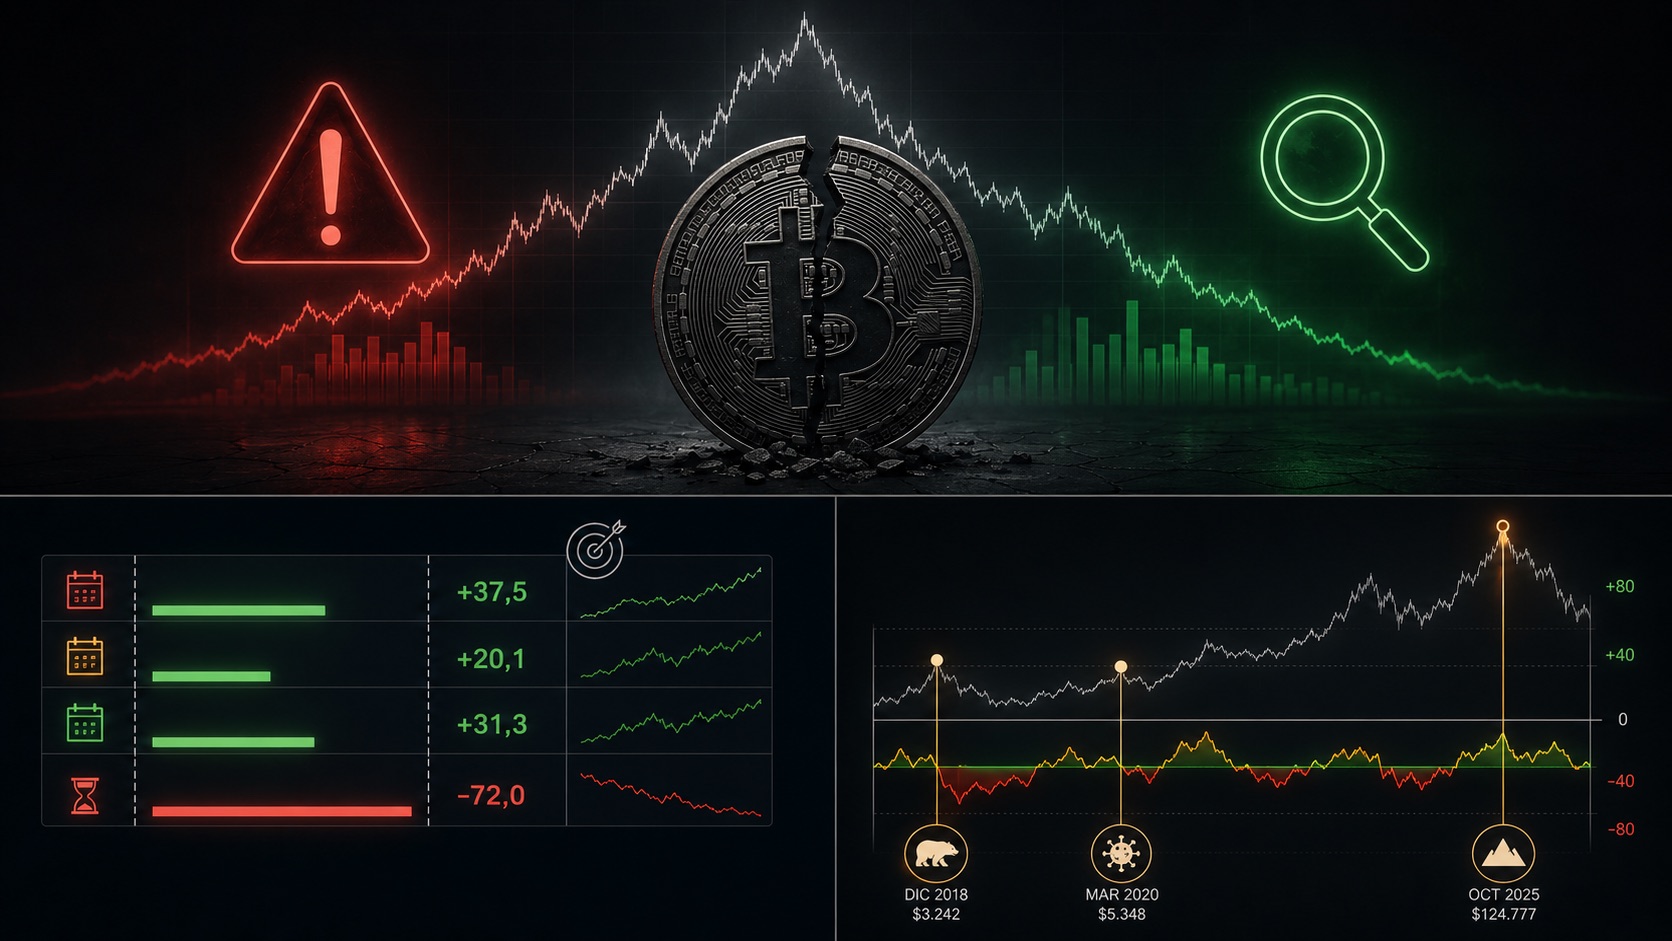
- At 3 months: +37.5 points of excess over random entry.
- At 6 months: +20.1 points of excess.
- At 12 months: +31.3 points of excess.
- At 24 months: -72.0 points of excess -- here it does work in the expected direction.
Illustrative medians, not statistically significant -- N=4 episodes across 2 cycles.
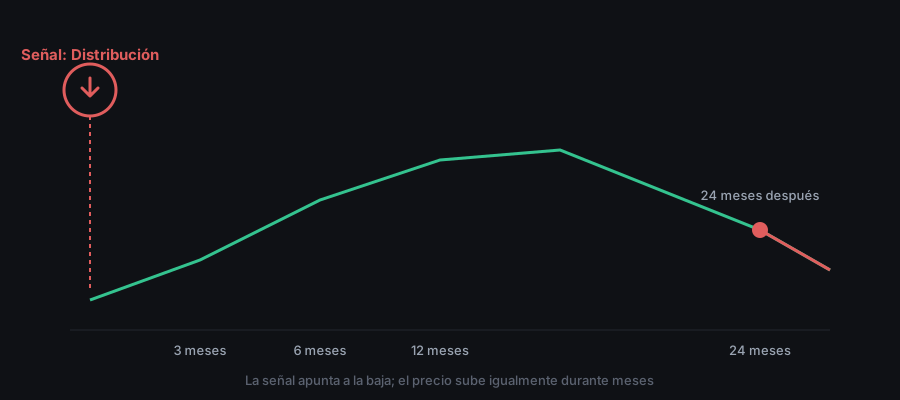
With only four evaluable episodes, none of these results is statistically conclusive on its own -- but the direction is consistent across the three short horizons, and consistent at the long one too. The honest reading isn't "the distribution signal is useless": it's that today it only carries a real hint at a multi-year horizon, not for deciding anything at weeks-or-months notice. Publishing the Score as if it marked the exact moment to sell would be precisely the promise this project doesn't want to make.
Failure 2: the Score didn't recognize the cycle's biggest extremes
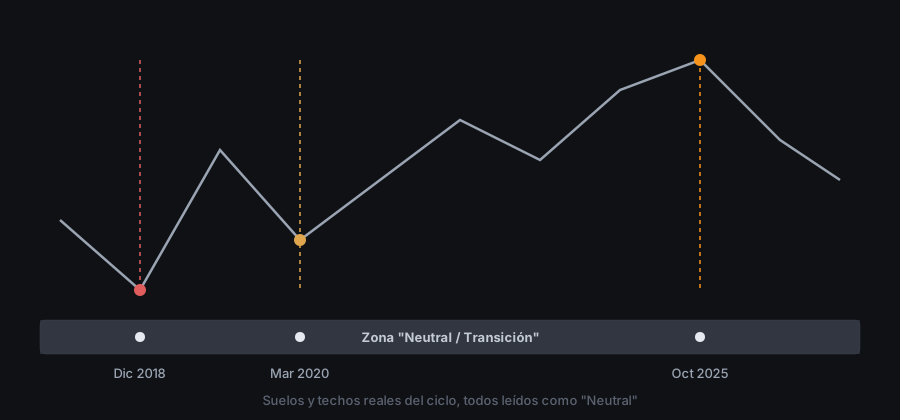
The second failure is different: it's not that the signal points the wrong way, it's that at several of Bitcoin's most extreme cycle moments, the reconstructed Score simply stayed flat, in the "Neutral / Transition" zone:
- December 2018 bottom ($3,242): Score +9.0, Neutral.
- COVID crash, March 2020 ($5,348): Score +14.8, Neutral.
- October 2025 top ($124,777): Score -14.6, Neutral. Its 72 days in the Distribution zone that year had started in January -- nine months before the actual top, not near it.
Across 8.5 years of reconstruction, the best reading the Score has ever reached is +51.1 (November 2022, after the FTX collapse) -- the "Strong Accumulation" band (+65) has never been reached.
Why does this happen? Without revealing internal thresholds or the combination formula (see the methodology for why that's withheld), two root causes have been identified:
- The aggregate compresses one side more than the other. The Score can shout "distribution" loudly, but only whispers "accumulation" -- a real asymmetry, verified while reconstructing the history, not an impression.
- The levels indicators are calibrated against aren't fixed forever. What marked a real market extreme a few years ago can today land only halfway there, because the market itself changes scale with every cycle.
Both causes are identified and under review for a future version of the Score -- they aren't an unexamined mystery, they're a known problem without an adopted solution yet.
Failure 3: the simulator's Score DCA hasn't demonstrated an advantage over traditional DCA
We also audited the Score DCA simulator's contribution multipliers -- the same five bands already public on the site (x2 on Strong Accumulation, x1.5 on Moderate Accumulation, x1 on Neutral, x0.5 on Moderate Distribution, pause on Strong Distribution) -- with the same rigor as the rest of this page: walk-forward, calibrating on 2018-2021 and validating on 2022-2026, over rolling 2-year windows with weekly contributions. The honest metric compares the same committed capital in both strategies: Score DCA's pending reserve counts as cash, it doesn't disappear from the calculation.
Result: Score DCA lagged traditional DCA in both halves of the period -- a median of -7.75% in the first (winning only 5 of 25 windows) and -2.18% in the second (winning 5 of 31). In 3-year windows it wins none at all: 0 of 13 in the first half, 0 of 19 in the second.
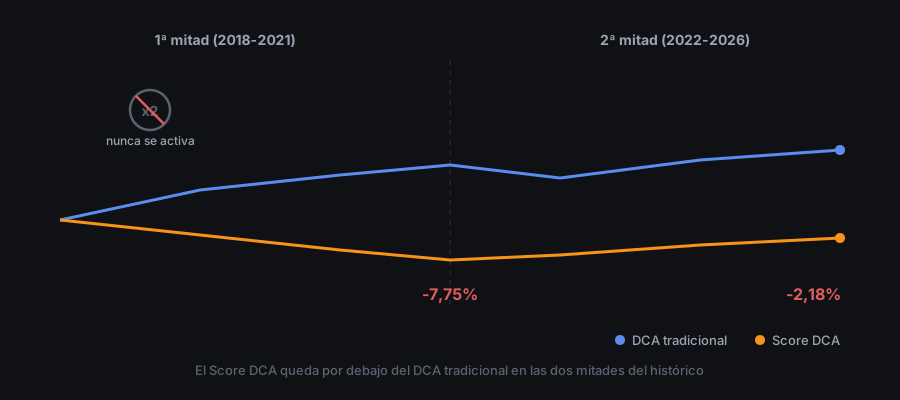
Overlapping rolling windows -- not independent samples. ~2 complete Bitcoin cycles in the history, no p-values.
The honest nuance runs both ways: Score DCA behaves like a lower-exposure strategy -- it wins precisely when the chosen period ends in a depressed market (like the ranges the simulator shows on the site today), and loses when it ends in a rally. What the simulator shows right now isn't false: it's the period's end point that decides the result, not a demonstrated average advantage.
This failure is, at bottom, the same story as the first two seen from another angle: the "Strong Accumulation" x2 multiplier hasn't activated a single time in 8.5 years of reconstruction, because that band has never been reached -- the same compression failure from Failure 2. And because of how the reserve mechanics work, accumulation multipliers can only redistribute money held back earlier during distribution phases -- precisely the signal that fails in Failure 1. All three failures are faces of the same diagnosis, not independent problems.
Something did get fixed as a result of this audit, already live on the site: the simulator's "Best result" badge was decided by a metric that excluded the pending reserve from the calculation and systematically favored Score DCA -- it was switched to the honest metric on July 11, 2026. The multipliers themselves didn't change: they remain, reframed as what they are -- a teaching demonstration of the Score's mechanics applied to DCA, not a strategy with a demonstrated advantage. The Score's own formula wasn't touched; you can see the full change history (including what's been evaluated without being adopted) in Score version history.
What's historical reconstruction and what's live history
Everything above is a reconstruction, not live history: it's calculated today, with today's data, over past dates, using 7 of the current Score's 10 indicators (without our own node, the heaviest-weighted one, which has no continuous history going back). The Score, as it exists today, wasn't calculating anything in 2018 or 2020 -- these figures are what today's same calculation would have said on those dates, not what it actually said back then.
That changes from now on: the Score has been live since July 1, 2026, and since July 8, 2026 we store, every day, the values of the indicators that feed it exactly as they're known that day ("vintage" snapshots) -- letting us recalculate the Score for any future day from frozen data that can't be edited with the passage of time. It's the difference between "trust us" and "check it yourself" -- and it's also why this page will keep growing: every real failure that shows up in the live history will be documented here just like the ones from the reconstruction.
What we're doing about it
We don't publish these failures and leave it there. Any change evaluated for the Score -- a new indicator, a threshold adjustment, a different way of combining signals -- goes through an internal protocol: it's calibrated on one stretch of history and validated on a completely different one, never the same one, and it's only adopted if it improves things robustly in both stretches at once. We keep a dated record of every variant evaluated, what it showed, and why it was adopted or discarded.
So far, several different variants have been evaluated under that protocol -- and none has met the bar for adoption. The Score hasn't been adjusted after seeing these results: the numbers above are the real ones, with no later tweak to soften them. The internal detail of those variants is part of what's withheld (see the methodology); its existence, and the fact that none has been enough yet, is not.
You can see the Score live, with all this context, in the Market section.
Last updated: 2026-07-11